 /* The source code for generating the above plot */
#include <math.h>
#include <chplot.h>
#define NUMX 150
#define NUMY 150
int main() {
double x[NUMX], y[NUMY], z[NUMX*NUMY];
double r;
int i, j;
class CPlot plot;
for(i=0; i<NUMY; i++) {
y[i]= -10 + i*20.0/(NUMY-1); // linspace(y, -10, 10);
}
for(i=0; i<NUMX; i++) {
x[i]= -10 + i*20.0/(NUMX-1); // linspace(x, -10, 10);
for(j=0; j<NUMY; j++) {
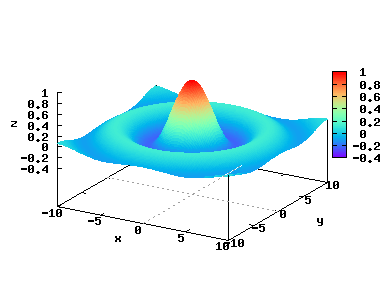
r = sqrt(x[i]*x[i]+y[j]*y[j]);
z[NUMY*i+j] = sin(r)/r; // peak function z in terms of (x, y)
}
}
plot.data3DSurface(x, y, z, NUMX, NUMY); // add 3D plotting data
// output of the plot as a png file, instead of displaying on screen by default
// plot.outputType(PLOT_OUTPUTTYPE_FILE, "png", "hat.png");
plot.plotting(); // get the plotting job done
return 0;
}
/* The source code for generating the above plot */
#include <math.h>
#include <chplot.h>
#define NUMX 150
#define NUMY 150
int main() {
double x[NUMX], y[NUMY], z[NUMX*NUMY];
double r;
int i, j;
class CPlot plot;
for(i=0; i<NUMY; i++) {
y[i]= -10 + i*20.0/(NUMY-1); // linspace(y, -10, 10);
}
for(i=0; i<NUMX; i++) {
x[i]= -10 + i*20.0/(NUMX-1); // linspace(x, -10, 10);
for(j=0; j<NUMY; j++) {
r = sqrt(x[i]*x[i]+y[j]*y[j]);
z[NUMY*i+j] = sin(r)/r; // peak function z in terms of (x, y)
}
}
plot.data3DSurface(x, y, z, NUMX, NUMY); // add 3D plotting data
// output of the plot as a png file, instead of displaying on screen by default
// plot.outputType(PLOT_OUTPUTTYPE_FILE, "png", "hat.png");
plot.plotting(); // get the plotting job done
return 0;
}
|