 /* The source code for generating the above plot */
#include <math.h>
#include <chplot.h>
#define POINTS 50 // number of data points for each curve
int main() {
double t[POINTS], b0[POINTS], b1[POINTS], b2[POINTS], b3[POINTS];
class CPlot plot;
int i;
/* get values of Bessel functions */
for(i=0; i< POINTS; i++) {
t[i] = 1+i*(10.0-1)/(POINTS-1);
b0[i] = j0(t[i]);
b1[i] = j1(t[i]);
b2[i] = jn(2, t[i]);
b3[i] = jn(3, t[i]);
}
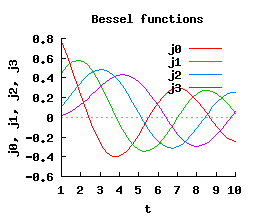
plot.title("Bessel functions"); // title
plot.label(PLOT_AXIS_X,"t"); // x-label
plot.label(PLOT_AXIS_Y,"j0, j1, j2, j3"); // y-label
plot.data2DCurve(t, b0, POINTS); // plotting data
plot.data2DCurve(t, b1, POINTS); // plotting data
plot.data2DCurve(t, b2, POINTS); // plotting data
plot.data2DCurve(t, b3, POINTS); // plotting data
plot.legend("j0", 0); // legend for j0
plot.legend("j1", 1); // legend for j1
plot.legend("j2", 2); // legend for j2
plot.legend("j3", 3); // legend for j3
plot.size(.40, 0.45); // change default plot size 640x480
/* output of the plot as a png file, instead of displaying on screen by default */
plot.outputType(PLOT_OUTPUTTYPE_FILE, "png", "bessel.png");
plot.plotting();
return 0;
}
/* The source code for generating the above plot */
#include <math.h>
#include <chplot.h>
#define POINTS 50 // number of data points for each curve
int main() {
double t[POINTS], b0[POINTS], b1[POINTS], b2[POINTS], b3[POINTS];
class CPlot plot;
int i;
/* get values of Bessel functions */
for(i=0; i< POINTS; i++) {
t[i] = 1+i*(10.0-1)/(POINTS-1);
b0[i] = j0(t[i]);
b1[i] = j1(t[i]);
b2[i] = jn(2, t[i]);
b3[i] = jn(3, t[i]);
}
plot.title("Bessel functions"); // title
plot.label(PLOT_AXIS_X,"t"); // x-label
plot.label(PLOT_AXIS_Y,"j0, j1, j2, j3"); // y-label
plot.data2DCurve(t, b0, POINTS); // plotting data
plot.data2DCurve(t, b1, POINTS); // plotting data
plot.data2DCurve(t, b2, POINTS); // plotting data
plot.data2DCurve(t, b3, POINTS); // plotting data
plot.legend("j0", 0); // legend for j0
plot.legend("j1", 1); // legend for j1
plot.legend("j2", 2); // legend for j2
plot.legend("j3", 3); // legend for j3
plot.size(.40, 0.45); // change default plot size 640x480
/* output of the plot as a png file, instead of displaying on screen by default */
plot.outputType(PLOT_OUTPUTTYPE_FILE, "png", "bessel.png");
plot.plotting();
return 0;
}
|