 /* The source code for generating the above plot */
/* File: legend.cpp
Plot multiple sets of data in arrays using member function
of plotting class CPlot */
#include <math.h>
#include <chplot.h>
#define N 37 /* number of points for the plot */
int main() {
int i, num=0;
double x[N], y[N], y2[N]; /* arrays with data for plotting */
class CPlot plot; /* instantiate a plotting class */
/* fill arrays with plotting data */
for(i=0; i<N; i++) {
x[i]= 0 + i*360.0/(N-1); // lindata(0, 360, x)
y[i] = sin(x[i]*M_PI/180); // Y-axis data
y2[i] = cos(x[i]*M_PI/180); // Y-axis data
}
/* set title, and x and y labels */
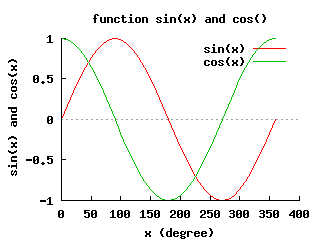
plot.title("function sin(x) and cos()");
plot.label(PLOT_AXIS_X, "x (degree)");
plot.label(PLOT_AXIS_Y, " sin(x) and cos(x)");
/* add the 1st set of data for plotting */
plot.data2DCurve(x, y, N);
/* add the legend for the 1st set of data */
plot.legend("sin(x)", num++);
/* add the 2nd set of data for plotting */
plot.data2DCurve(x, y2, N);
/* add the legend for the 2nd set of data */
plot.legend("cos(x)", num);
/* plot it */
/* output of the plot as a png file, instead of displaying on screen by default */
plot.outputType(PLOT_OUTPUTTYPE_FILE, "png", "legend.png");
plot.plotting();
return 0;
}
/* The source code for generating the above plot */
/* File: legend.cpp
Plot multiple sets of data in arrays using member function
of plotting class CPlot */
#include <math.h>
#include <chplot.h>
#define N 37 /* number of points for the plot */
int main() {
int i, num=0;
double x[N], y[N], y2[N]; /* arrays with data for plotting */
class CPlot plot; /* instantiate a plotting class */
/* fill arrays with plotting data */
for(i=0; i<N; i++) {
x[i]= 0 + i*360.0/(N-1); // lindata(0, 360, x)
y[i] = sin(x[i]*M_PI/180); // Y-axis data
y2[i] = cos(x[i]*M_PI/180); // Y-axis data
}
/* set title, and x and y labels */
plot.title("function sin(x) and cos()");
plot.label(PLOT_AXIS_X, "x (degree)");
plot.label(PLOT_AXIS_Y, " sin(x) and cos(x)");
/* add the 1st set of data for plotting */
plot.data2DCurve(x, y, N);
/* add the legend for the 1st set of data */
plot.legend("sin(x)", num++);
/* add the 2nd set of data for plotting */
plot.data2DCurve(x, y2, N);
/* add the legend for the 2nd set of data */
plot.legend("cos(x)", num);
/* plot it */
/* output of the plot as a png file, instead of displaying on screen by default */
plot.outputType(PLOT_OUTPUTTYPE_FILE, "png", "legend.png");
plot.plotting();
return 0;
}
|