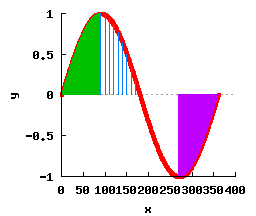
 /* The source code for generating the above plot */
#include <math.h>
#include <chplot.h>
int main() {
int numpoints = 360, // number of data points
numpts=10; // number of data points
array double x0[numpoints], y0[numpoints];
array double x1[numpoints], y1[numpoints];
array double x2[numpts], y2[numpts];
array double x3[numpoints], y3[numpoints];
int line_type=0, line_width =5;
class CPlot plot;
linspace(x0, 0, 360); // assign x0 with -10 <= x0 <= 360 linearly
y0 = sin(x0*M_PI/180); // array y0 is sine of array x0, element-wise
linspace(x1, 0, 90); // assign x1 with 0 <= x1 <= 90 linearly
y1 = sin(x1*M_PI/180); // array y1 is sine of array x1, element-wise
linspace(x2, 90, 180); // assign x2 with 90 <= x2 <= 180 linearly
y2 = sin(x2*M_PI/180); // array y2 is sine of array x2, element-wise
linspace(x3, 270, 360); // assign x3 with 90 <= x3 <= 180 linearly
y3 = sin(x3*M_PI/180); // array y3 is sine of array x3, element-wise
plot.data2D(x0, y0);
plot.data2D(x1, y1);
plot.data2D(x2, y2);
plot.data2D(x3, y3);
plot.plotType(PLOT_PLOTTYPE_LINES, 0, line_type, line_width); // line for (x0,y0)
plot.plotType(PLOT_PLOTTYPE_IMPULSES, 1); // impulse plot for (x1, y1)
plot.plotType(PLOT_PLOTTYPE_IMPULSES, 2); // impulse plot for (x2, y2)
plot.plotType(PLOT_PLOTTYPE_IMPULSES, 3); // impulse plot for (x3, y3)
plot.size(.40, 0.45); // change default plot size 640x480
/* output of the plot as a png file, instead of displaying on screen by default */
plot.outputType(PLOT_OUTPUTTYPE_FILE, "png color", "impulse.png");
plot.plotting(); // get the plotting job done
}
/* The source code for generating the above plot */
#include <math.h>
#include <chplot.h>
int main() {
int numpoints = 360, // number of data points
numpts=10; // number of data points
array double x0[numpoints], y0[numpoints];
array double x1[numpoints], y1[numpoints];
array double x2[numpts], y2[numpts];
array double x3[numpoints], y3[numpoints];
int line_type=0, line_width =5;
class CPlot plot;
linspace(x0, 0, 360); // assign x0 with -10 <= x0 <= 360 linearly
y0 = sin(x0*M_PI/180); // array y0 is sine of array x0, element-wise
linspace(x1, 0, 90); // assign x1 with 0 <= x1 <= 90 linearly
y1 = sin(x1*M_PI/180); // array y1 is sine of array x1, element-wise
linspace(x2, 90, 180); // assign x2 with 90 <= x2 <= 180 linearly
y2 = sin(x2*M_PI/180); // array y2 is sine of array x2, element-wise
linspace(x3, 270, 360); // assign x3 with 90 <= x3 <= 180 linearly
y3 = sin(x3*M_PI/180); // array y3 is sine of array x3, element-wise
plot.data2D(x0, y0);
plot.data2D(x1, y1);
plot.data2D(x2, y2);
plot.data2D(x3, y3);
plot.plotType(PLOT_PLOTTYPE_LINES, 0, line_type, line_width); // line for (x0,y0)
plot.plotType(PLOT_PLOTTYPE_IMPULSES, 1); // impulse plot for (x1, y1)
plot.plotType(PLOT_PLOTTYPE_IMPULSES, 2); // impulse plot for (x2, y2)
plot.plotType(PLOT_PLOTTYPE_IMPULSES, 3); // impulse plot for (x3, y3)
plot.size(.40, 0.45); // change default plot size 640x480
/* output of the plot as a png file, instead of displaying on screen by default */
plot.outputType(PLOT_OUTPUTTYPE_FILE, "png color", "impulse.png");
plot.plotting(); // get the plotting job done
}
|
|