|
|


|
|
SoftIntegration Graphical Library (SIGL) is a cross-platform
C++ graphical
library. It provides
the simplest possible solution for two- and three-dimensional
graphical plotting within the framework of C/C++ for rapid application
development and deployment.
SIGL is for applications where the convenience of use, speed, performance, and cost matter. SIGL can save you from significant development and maintenance cost. With SIGL, you can design and deploy your engineering and science applications with visualization across different platforms.
SIGL has the following major features:
-
SIGL contains a plotting class in C++ with over 100 member functions for conveniently creating and manipulating two- and three-dimensional plots. You can compile and link your C/C++ programs with SIGL using your desired C++ compiler.
-
SIGL has easy-to-use high-level plotting functions plotxy(), fplotxy(), plotxyf(), plotxyz(), fplotxyz(), and plotxyzf() using data from arrays, functions, and data files conveniently.
-
Numerous plot types in different coordinates and shapes.
-
Plots can be generated for display on the screen, display
inside a Web browser through a Web server,
or saved in a file with
a variety of different file formats,
including PNG, JPEG, GIF, Postscript, LaTeX, etc.
-
A displayed plot can be conveniently copied and pasted into other applications such as Word in Windows.
-
SIGL is portable across different platforms in both 32 and 64 bit machines.
-
SIGL is compatible with
plotting in Ch.
The plotting class and functions in SIGL are supported in Ch. A program using the plotting feature can be either compiled in C++ compiler or run in Ch interpretively without compilation. A C++ program using SIGL can be developed and readily compiled in
ChIDE,
which is bundled in Ch Professional Edition and Ch Student Edition.
Winplot is an example of how interactive plotting
can be accomplished in Ch with
mathematical expressions entered by the user
through a graphical user
interface in Windows.
Winplotanim is an example of how
real-time data can be interactively plotted
in Ch with
mathematical expressions entered by the user
through a graphical user
interface in Windows.
For distribution of run-time components in SIGL with your application,
please contact us at info@softintegration.com.
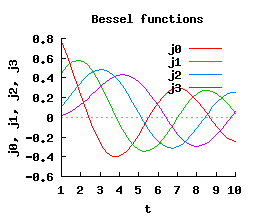
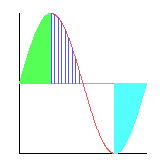
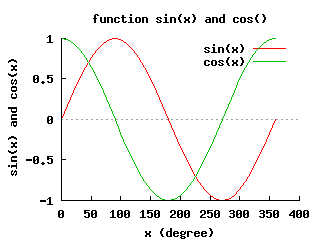
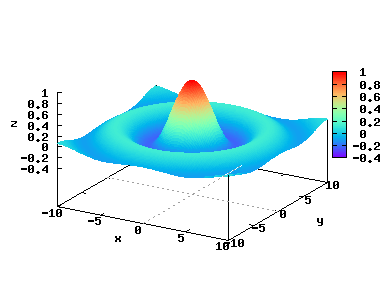
There are over 100 demo programs in the distribution of
SIGL.
Click a plot below to view the corresponding program
that generates the plot readily for display
through the Web.
|
|