|
ChIDE User's Guide
-
Introduction
-
Getting Started
-
Editing and Executing C/Ch/C++ Programs, the First Example with Output
-
Indenting Programs
-
Setup Paths and Finding Commands in Ch
-
Executing the Second Example with Input
-
Executing the Third Example with Plotting
-
Executing the Fourth Example with Command Line Arguments
-
Debugging C/Ch/C++ Programs
-
Using Debug Commands Inside the Debug Command Pane
-
Interactive Execution of Commands in the Output Pane
-
Compiling and Linking C/C++ Programs
-
Buffers in ChIDE
-
Sessions in ChIDE
-
Languages Understood by ChIDE
-
Edit in ChIDE
-
Find and Replace in ChIDE
-
Keyword Commands in ChIDE
-
Abbreviations in ChIDE
-
Folding in ChIDE
-
Encodings in ChIDE
Introduction
ChIDE is an Integrated Development Environment (IDE) to edit, debug,
and run C/Ch/C++ programs in Ch.
Ch
is an embeddable C/C++ interpreter for cross-platform scripting,
shell programming, 2D/3D plotting, numerical computing, and embedded scripting.
ChIDE is developed using Embedded Ch.
ChIDE can also compile and link edited C/C++ programs
using C and C++ compiler of your choice, such as Microsoft Visual Studio .NET in Windows,
and gcc/g++ in Linux and Mac OS X x86.
The user interface of ChIDE can be in one of many local languages such as
German, French, Chinese, Korean, and Japanese.
This documentation describes some features of ChIDE and how they are used to develop programs. The most updated documentation for ChIDE is available
here.
Getting Started
ChIDE is available in Windows, Linux, and Mac OS X x86
for Ch Professional, Student, and Evaluation Editions.
ChIDE can be launched by running the command
chide.
In Windows, ChIDE can also be conveniently launched by clicking its icon shown in
Figure 1 on the desktop.

Figure 1: A ChIDE icon on a desktop in Windows, Mac OS X, and Linux.
In Mac OS X x86, ChIDE can also be launched by clicking the icon
shown in Figure 1
on the dashboard or
in the Applications folder.
In Linux, it can also be launched under the entry Programming Tools in the startup menu.
In Linux,
The command
ch -d
will create an icon for Ch on the desktop.
If Ch is installed with a ChIDE, an icon for ChIDE will also be created on the desktop.
When the ChIDE is launched, its graphical user interface
appears as in
Figure 2.
The information as described here will be displayed if clicking
Help | ChIDE Help command.
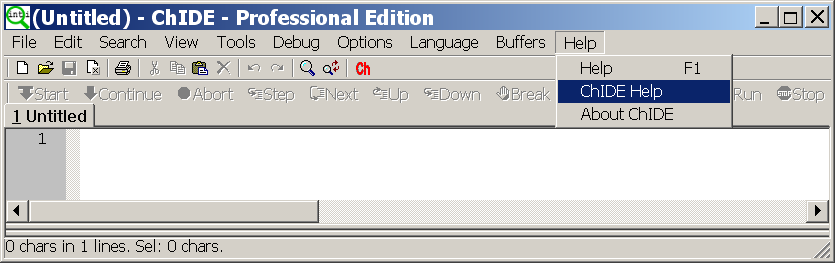
Figure 2: Getting on-line help on how to use ChIDE.
Click the
Ch
icon on the toolbar in ChIDE or on the desktop, a Ch command shell shown in
Figure 3 will be launched.
The colors of the text and background as well as the window size and font size of the shell window can be changed by
right clicking the Ch icon at the upper left corner of the window,
and select Properties menu to make changes.
Note that for Windows Vista, you need to run ChIDE with the administrative privilege
to make such a change.
In this command shell,
MS-DOS and Unix commands can be executed. C or C++ statements as well as C/Ch/C++ programs can also be executed interactively as shown in
Figure 3.
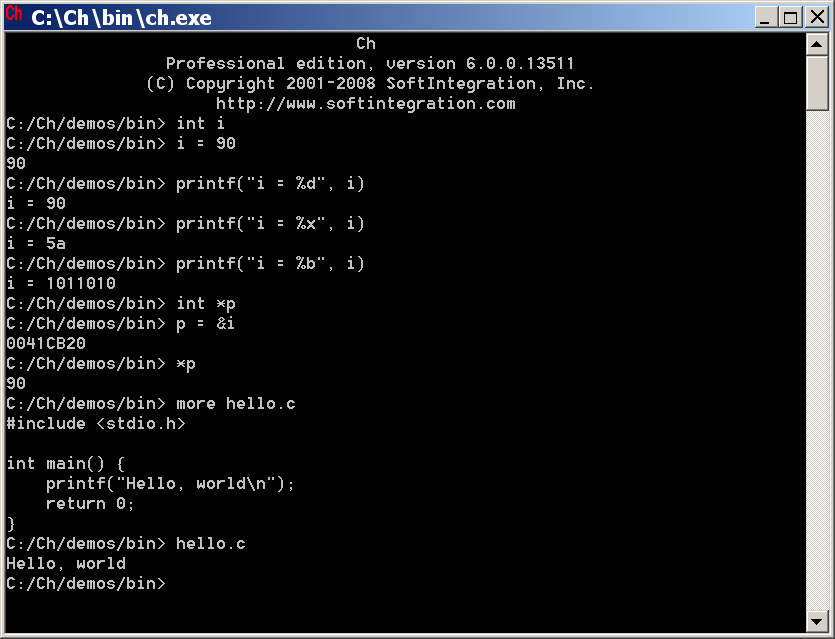
Figure 3: Ch command shell.
Editing and Executing C/Ch/C++ Programs, the First Example with Output
Text editing in ChIDE works similarly to most Macintosh or Windows editors such as Notepad with the added
feature of automatic syntax styling.
ChIDE can hold multiple files in memory at one time but
only one file will be visible. ChIDE allows up to 20 files in memory
at once.
Rectangular
regions of text can be selected in ChIDE by holding down the Alt key on Windows or the Ctrl
key on GTK+ while dragging the mouse over the text.
There are four panes in ChIDE: the editing pane, debug pane, debug command pane,
and output pane.
The debug pane is
located either to the below of the editing pane or on the right.
Initially it is of zero size, but
it can be made larger by dragging the divider between it and the editing pane.
The debug command pane is
located either to the below of the debug pane or on the right.
Similarly, the output pane is
located either to the below of the debug pane or on the right.
The output pane is on the left of the debug command pane.
Initially the output pane is of zero size, but
it can also be made larger by dragging the divider between it and the debug pane.
By default, the output from the program is directed into the output pane.
The View | Vertical Split command
can be used to change the layout of the ChIDE in vertical
mode, in which the editing pane is on the left,
the debug pane is in the middle, and
the output pane and debug command pane are on the right.
The location and size of the ChIDE,
the sizes of editing pane, debug pane, and output pane
in the current session are saved when ChIDE is closed.
When ChIDE is started next time, these saved values
in the previous session will be used for the new session.
The command
View | Default Layout will use the values in
ChIDE global and user options files to reset ChIDE to
use the default layout.
The edited C/Ch/C++ program in ChIDE can readily be
debugged or executed in Ch interpretively without compilation.
The edited program can also be compiled and linked using C or C++ compiler such as Microsoft Visual Studio .NET, and executed in ChIDE.
The output from the program
are directed into the output pane.
For example, open
a new document, type:
#include <stdio.h>
int main() {
printf("Hello, world!\n");
return 0;
}
as that document's text.
The same program hello.c in CHHOME/demos/bin/hello.c, where CHHOME is the home directory for Ch such as C:/Ch in Windows for
C:/Ch/demos/bin/hello.c,
can also be loaded using File | Open command. In Windows, a program listed under
the Windows explorer can also be dragged and dropped
on to the ChIDE, which will open the program in the editing pane.
The program should now appear coloured with syntax highlighting as shown in
Figure 4.
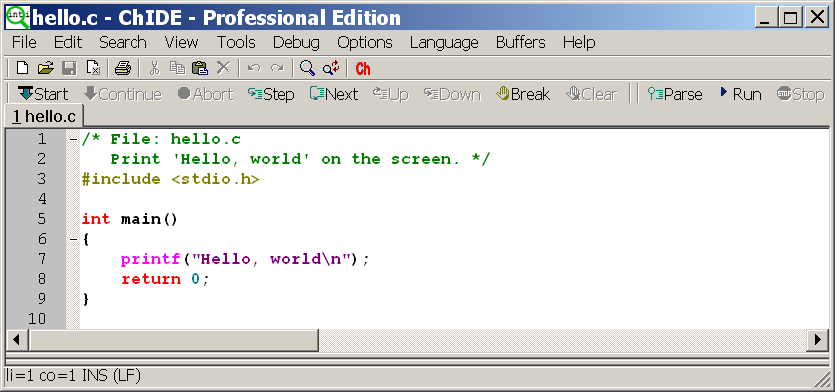
Figure 4: The program hello.c edited inside the editing pane in ChIDE.
For the classroom presentation, the font size of the displayed
program can be enlarged by clicking the command
View | Change Font Size, and then make changes.
The line numbers, margin, and fold margin on the left side of the editing pane
can be suppressed
as shown in
Figure 5
by clicking the commands
View | Line Numbers, Margin, Fold Margin, respectively.
The fold point markers '-'
and '+' on the fold margin
can be clicked to expand and contract a fold
for a block of code, respectively.
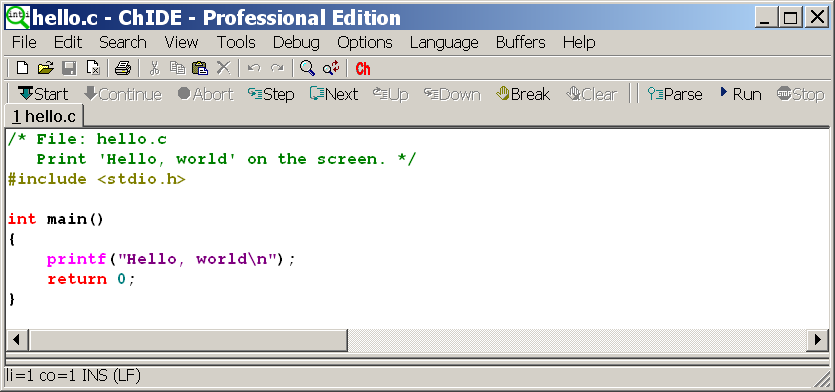
Figure 5: The program hello.c displayed without line numbers, margin, and
fold margin in ChIDE.
Save the document as hello.c
by the command File | Save As
as shown in
Figure 6.
You can also right click the file on the file name
on the Tab bar, located below the debug bar,
and then select the command Save As to save the program
as shown in Figure 7.
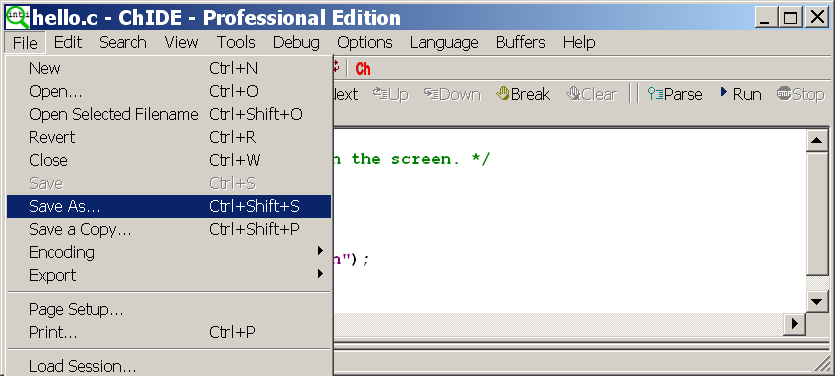
Figure 6: Saving the edited program hello.c using the command File | Save As.
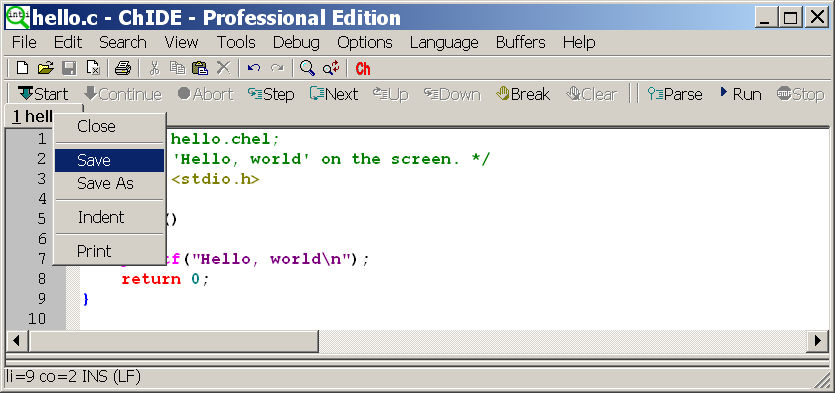
Figure 7: Saving the edited program hello.c by right clicking the
file name.
A C/Ch/C++ program with the file extension
.c,
.ch,
.cpp,
.cc,
and .cxx, or without file extension can readily be executed in ChIDE.
Perform the Run or Tools | Run as shown in
Figure 8 to execute the program hello.c.
Instead of performing the Run or Tools | Run command, pressing function key F2
will have the same effect of executing the program.
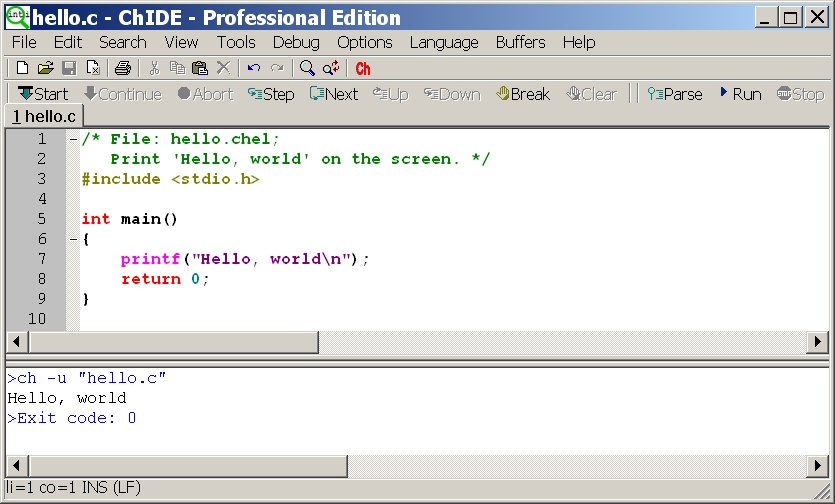
Figure 8: Executing program hello.c and its output
When the program hello.c is executed,
the output pane will be made visible if it is not already visible and will show:
                >ch -u "hello.c"

                Hello, world!

                >Exit code: 0
as displayed in
Figure 8.
The first blue line is from ChIDE showing the command it will use to run the program. The black
line is the output from running the Ch program. The last blue line is from ChIDE showing
that the program has finished and displaying its exit code. An exit code of zero indicates a
successful run.
ChIDE understands the error messages produced by Ch.
To see this, add a mistake to
the Ch file by changing the line
printf("Hello, world\n");
to
printf("Hello, world\n";
Run the modified program. The results should look below
>ch -u "hello.c"
ERROR: missing ')' before ';'
  ERROR: syntax error before or at line 7 in file 'hello.c'
  ==>:    printf("Hello, world\n";
  BUG:    printf("Hello, world\n"; <== ???
ERROR: cannot execute command 'hello.c'
>Exit code: 1
as shown in
Figure 9.
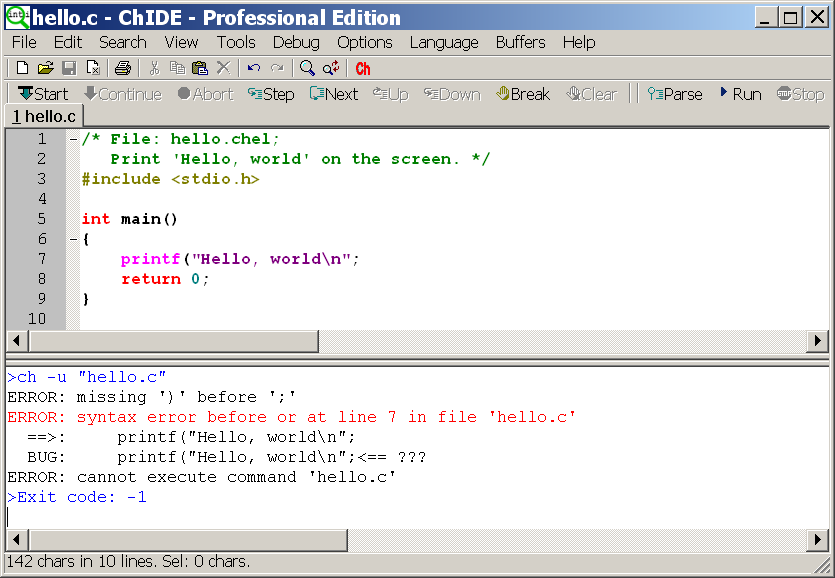
Figure 9: The error line in output from executing program hello.c
Click the line in output with red color in Figure 10,
the line with incorrect syntax will be highlighted as shown in
Figure 10.
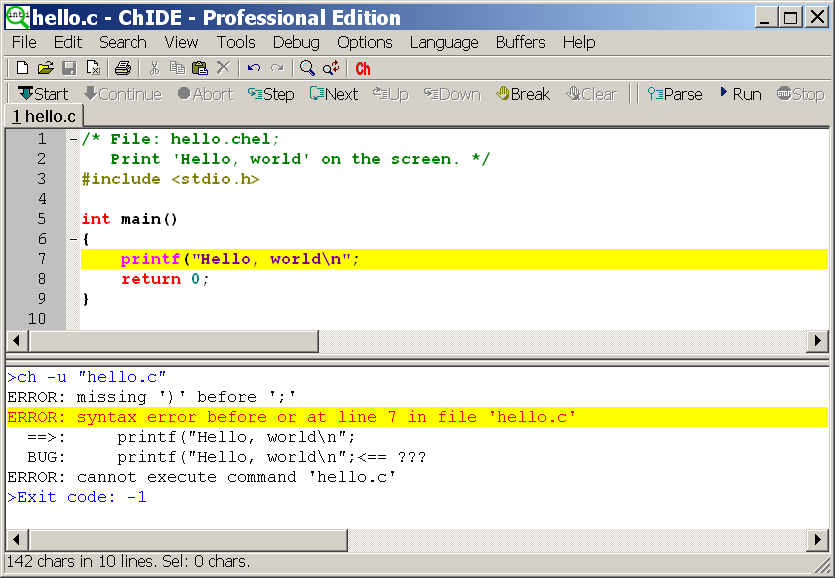
Figure 10: Finding the error line in output from executing program hello.c
While it is easy to see where the problem is in this simple case, when a file is larger the
Tools | Next Error Message command or the function key F4 can be used to view each of the reported errors. Upon performing
Tools | Next Error Message, the first error message in the output pane
and the appropriate line in the editing pane are
highlighted with a yellow background,
The caret is moved to this line and the pane is scrolled if needed to show the line. ChIDE
now looks like in
Figure 10.
The command Tools | Previous Error Message, or the function key Shift+F4,
can be used to view the previous error message.
ChIDE understands both the file name and line number parts of error messages in most cases
so can open another file (such as a header file) if errors were caused by that file. This
feature may not work where the file name is complicated by containing spaces or ".."
The output pane can be opened and closed by the command
View | Output Pane.
The contents of the console window can be cleared by the command
View | Clear Output Pane or the function key F9
as shown in Figure 11.

Figure 11: Clearing the contents in the output pane.
If command execution has failed and is taking too long to complete then the Stop or Tools | Stop Executing command can be used.
On Windows, ChIDE defaults to execute tools as command line programs. Executing a GUI
program in this mode results in that program being run without displaying a window.
The
command.subsystem option can be used to define tools that run in GUI mode. The default
subsystem, 0, is for command line programs, 1 is for programs which create their own windows,
and 2 is for using the
ShellExecute call.
To run a GUI program such as OpenGL and Windows,
use Launch Ch Shell command in Ch icon to launch a Ch shell. Run the GUI program in this shell.
On GTK+, the default subsystem 0
executes the tool and waits for it to finish, redirecting output to the output pane and
subsystem 2 executes the tool in the background.
You may use command Parse or Tools | Parse to just check the syntax error of the program without executing it,
Indenting Programs
For readability and software
maintenance, each line in a program should be properly
indented.
The command
Tools | Indent on the toolbar properly
indents the program in the editing pane.
You can also right click the file on the file name
on the Tab bar, located below the debug bar,
and then select the command Indent to indent the program.
Figure 34
shows all commands including the command Indent under the command Tools.
Figure 7
shows the command Indent when the file name is right clicked.
Setup Paths and Finding Commands in Ch
When a command is typed into a prompt of a command shell
for execution, the command shell will search for the command
in prespecified directories.
In a Ch shell, the system variable
_path of string type
contains the directories to be searched
for the command.
Each directory is separated by a semicolon inside the string _path.
When a Ch command shell is launched,
the system variable _path contains some default search paths.
The user can add new directories
to the search paths for the command shell by using the string
function stradd() which adds arguments of string type and returns
it as a new string.
For example, the directory
C:/Documents and Settings/Administrator/c99
is not in the search paths for a command.
If you try to run program hello.c in this directory when the current
working directory is
C:/Documents and Settings/Administrator.
The Ch shell will not be able to find this program as shown below
and give two error messages.
C:/Documents and Settings/Administrator> hello.c
ERROR: variable 'hello.c' not defined
ERROR: command 'hello.c' not found
When Ch is launched or
a Ch program is executed, by default, it will
execute the startup file .chrc in Unix or
_chrc in Windows in the user's home directory
if it exists.
In the remaining presentation, it is assumed
that Ch is used in Windows with a startup file
_chrc in the user's home directory.
This startup file typically sets up the search paths
for commands, functions, header files, etc.
In Windows, a startup file _chrc with default setup is created
in the user's home directory during installation of Ch.
However, there is no startup file in a user's home
directory in Unix by default.
The system administrator may add such a startup file .chrc
in a user's home directory.
However, the user can execute Ch with the option -d as follows
ch -d
to copy a sample startup file from
the directory CHHOME/config/ to
the user's home directory if there is no
startup file in the home directory yet.
Note that CHHOME is not the string "CHHOME", instead it uses the
file system path under which Ch is installed.
For example, by default, Ch is installed in
C:/Ch in Windows and /usr/local/ch in Unix.
In Windows, the command in a Ch shell below
C:/Documents and Settings/Administrator> ch -d
will try to overwrite the startup file
_chrc in the user's home directory
C:/Documents and Settings/Administrator.
This local Ch initialization startup file
_chrc
can be opened for editing
the search paths by
ChIDE editor as shown in
Figure 12.
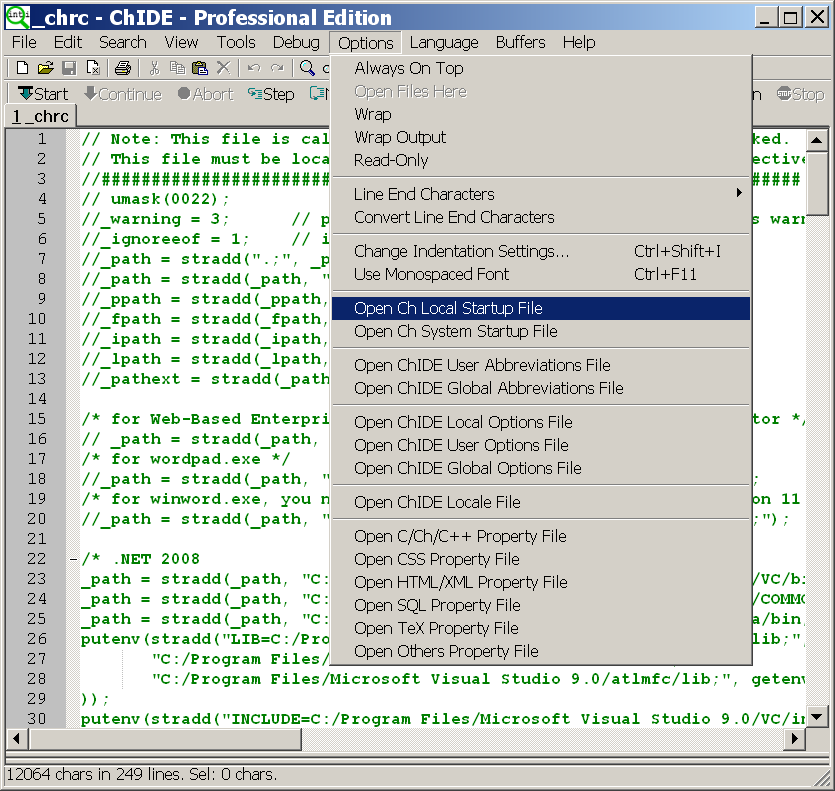
Figure 12: Opening the local Ch initialization startup file for editing.
To include the directory C:/Documents and Settings/Administrator/c99
in the search paths for a command,
the following statement
_path = stradd(_path, "C:/Documents and Settings/Administrator/c99;");
needs to be added
to the startup file _chrc in the user's home directory
so that
the command hello.c in this directory can be invoked regardless of what
the current working directory is. After the directory
C:/Documents and Settings/Administrator/c99 has been added to the
search path, _path, you need to restart a Ch command shell.
Then, you will be able to execute the program
hello.c in this directory as shown below.
C:/Documents and Settings/Administrator> hello.c
Hello, world
Similar to
_path for commands,
the header files in Ch are searched in
directories specified in
the system variable _ipath.
Each path is also delimited by a semicolon.
For example, the statement below
_ipath = stradd(_ipath, "C:/Documents and Setting/Administrator/c99;");
adds the directory
C:/Documents and Setting/Administrator/c99
to the search paths for header files.
One can also add this directory to the function file search paths
by the statement
_fpath = stradd(_fpath, "C:/Documents and Setting/Administrator/c99;");
In Unix, the search paths for commands by default do not contain
the current working directory.
To include the current working
directory in the search paths for a command,
the following statement
_path = stradd(_path, ".;");
in startup file .chrc in the user's home directory
needs to be added.
Function call
stradd(_path, ".;")
adds the current directory represented by
'.' to the system search paths _path.
Executing the Second Example with Input.
This example shows how to run a C/Ch/C++ program/script that requires the user to input data. Type in the code as shown in
Figure 13.
The same program C:/Ch/demos/bin/scanf.c
can also be loaded using File | Open command.
During execution, this code should ask the user to "Please input a number" and then cause the system to output "Yout input number is" and the number that the user inputed.

Figure 13: Executing the program with input and output.
During the execution of the program, the user will be prompted to input a number as shown in
Figure 13.
The user then must type in a number in the same pane for both input and output.
Both input number of 56 and output are shown in
Figure 13.
Executing the Third Example with Plotting
This example shows how to run a C/Ch/C++ program/script that creates a plot.
Type in the code as shown in
Figure 14.
The same program C:/Ch/demos/bin/fplotxy.cpp
as shown in Figure 14
can also be loaded using File | Open command.
When the program is executed, it creates a plot shown
in Figure 15.
The plotting function fplotxy() is available in Ch or SoftIntegration Graphical Library.
The program shown in Figure 14
uses the plotting function fplotxy() to plot function func() with 37 points and with the x value in the range from 0 to 360.
To compile a program using plotting features with header file chplot.h,
the program has to be treated as a C++ program with file extension .cpp
to link with a SIGL C++ plotting library.
How to compile a C++ program using a C++ compiler will be described later.
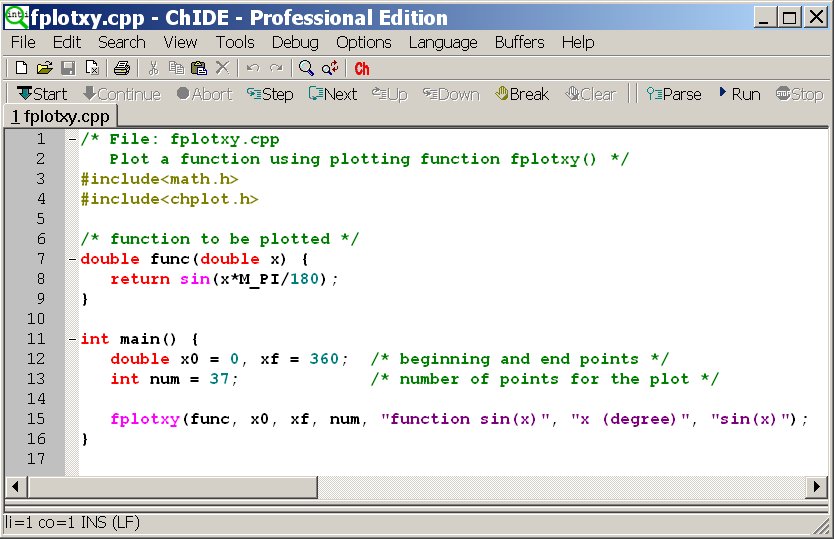
Figure 14: A plotting program using fplotxy().
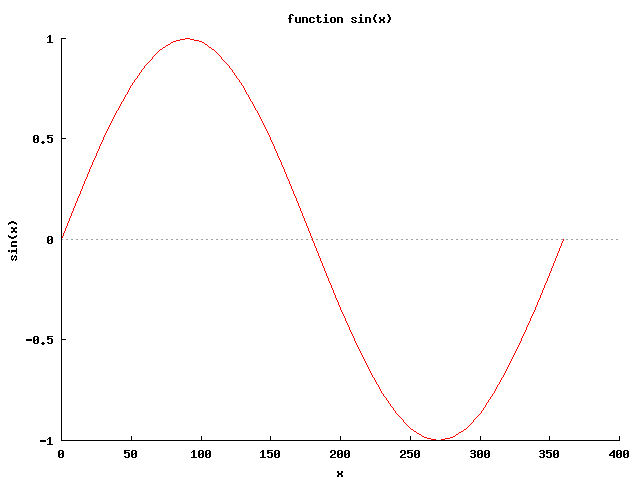
Figure 15: The output of the plotting program.
The plotting function plotxy() is available to plot data stored in C arrays.
The program C:/Ch/demos/bin/fplotxy.cpp
shown in Figure 16 uses regular C array
to store the data used for plotting.
When the program
C:/Ch/demos/bin/plotxy.cpp
shown in
Figure 16
is loaded and executed, it creates the same plot shown
in Figure 15.
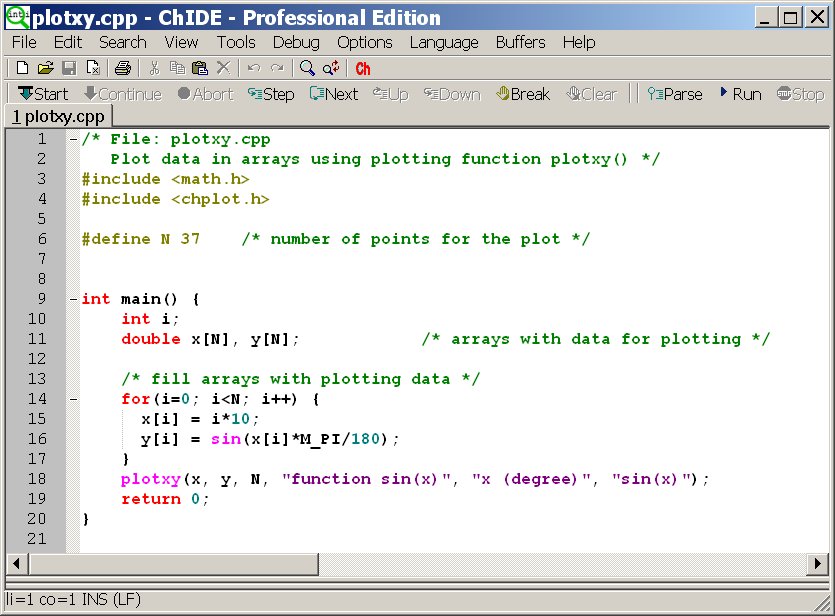
Figure 16: A plotting program using plotxy().
The plotting function fplotxy() can be used to plot three-dimensional functions with two variables
as shown in Figure 17.
This program plot function cos(x)sin(y) for the x value in the range from -3 to 3
and y in the range of -4 to 4. The plot uses 80 points for both x and y.
When the program
C:/Ch/demos/bin/fplotxyz.cpp
shown in
Figure 17
is loaded and executed, it creates the plot shown
in Figure 18.
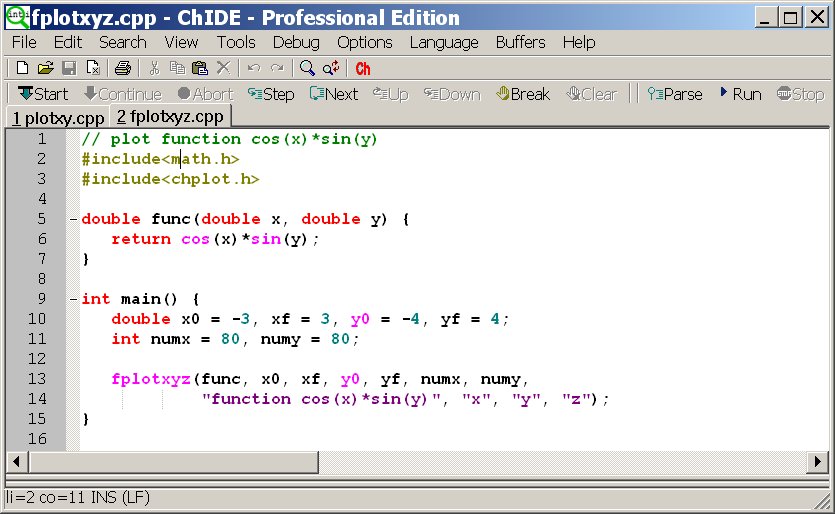
Figure 17: A plotting program using fplotxyz().
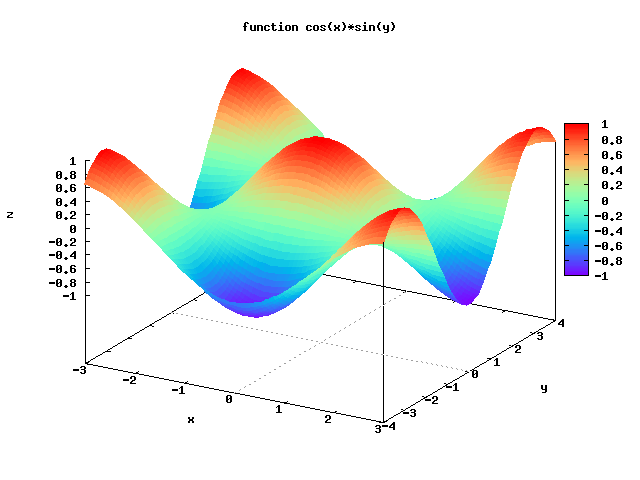
Figure 18: The output of the plotting program using fplotxyz().
Executing the Fourth Example with Command Line Argument.
ChIDE has 4 properties $(1) .. $(4) which can be used to run commands with
changeable command line arguments. To set the command line arguments, use the Tool | Command Line Arguments
command to view the modeless Command Line Argument dialog which shows the current command line arguments
and allows setting new values. The accelerator keys for the main
window remain active while this dialog is displayed, so it can be used to rapidly run
a command several times with different arguments. Alternatively, a command can be
made to display the modal Command Line Arguments dialog when executed by starting the
command with a '*' which is otherwise ignored as shown below.
* C:/Ch/demos/bin/commandarg.c
* "C:/Ch/demos/bin/commandarg.c"
If the modeless Command Line Arguments dialog is
already visible, then the '*' is ignored.
The program in Figure 19
shows how to run a C/Ch/C++ program/script with command line arguments.
This program will accept the command line arguments and print them out.
The command line arguments are setup in Tool|Command Line Arguments menu as shown in
Figure 20
and Figure 21.
The output from execution of this program with command line arguments is displayed in
Figure 22
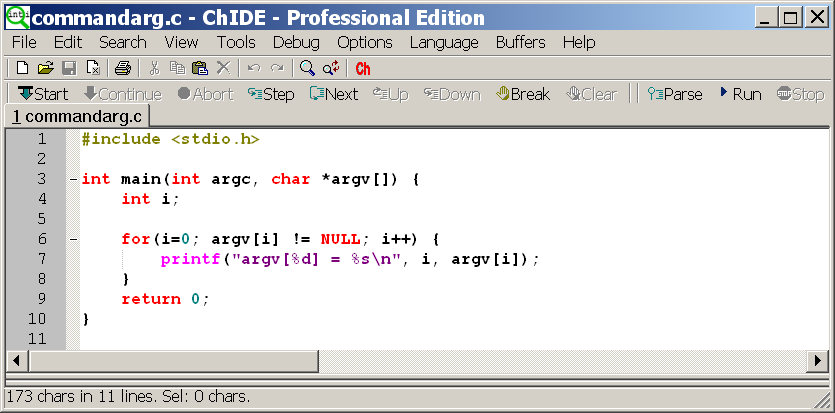
Figure 19: A program for handling command line arguments.
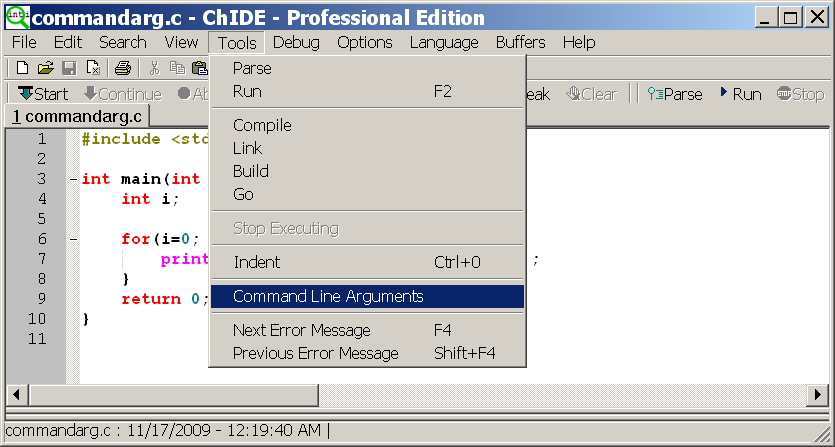
Figure 20: Setting command line arguments.
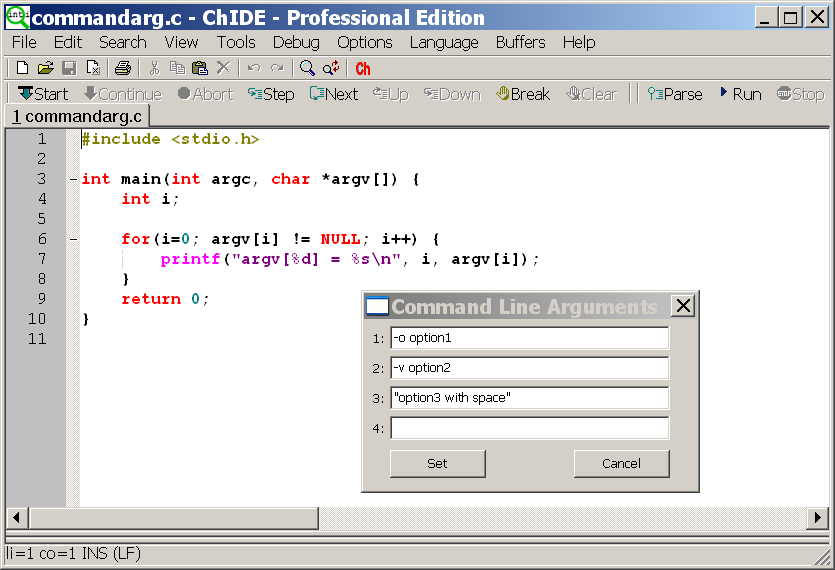
Figure 21: Setting command line arguments.
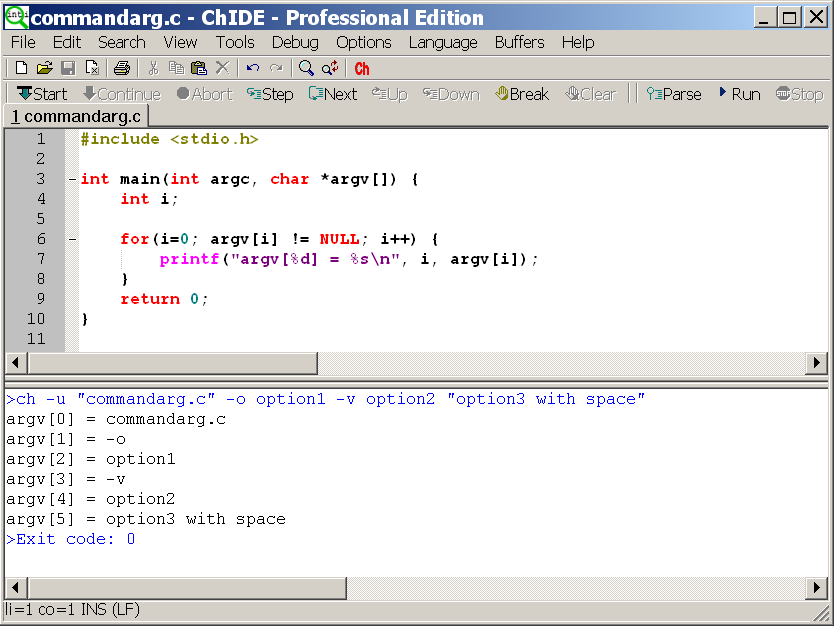
Figure 22: Executing the program with command line arguments.
Debugging C/Ch/C++ Programs
The ChIDE has all capabilities available in a typical debugger
for binary C programs.
The debug interface commands, such as
Start and Step, are shown in
Figure 23.
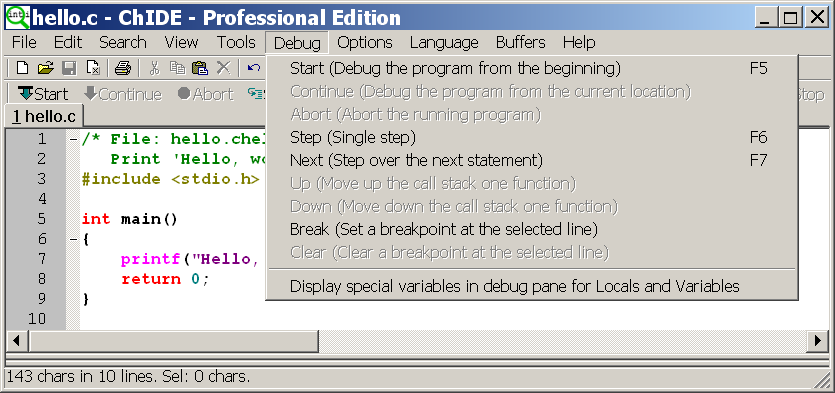
Figure 23: Debug menus.
They are also available directly on the debug bar as shown in
Figure 24.
The applicable commands in the debug bar at any point of debugging will be clickable.
Non-clickable commands are dimmed.
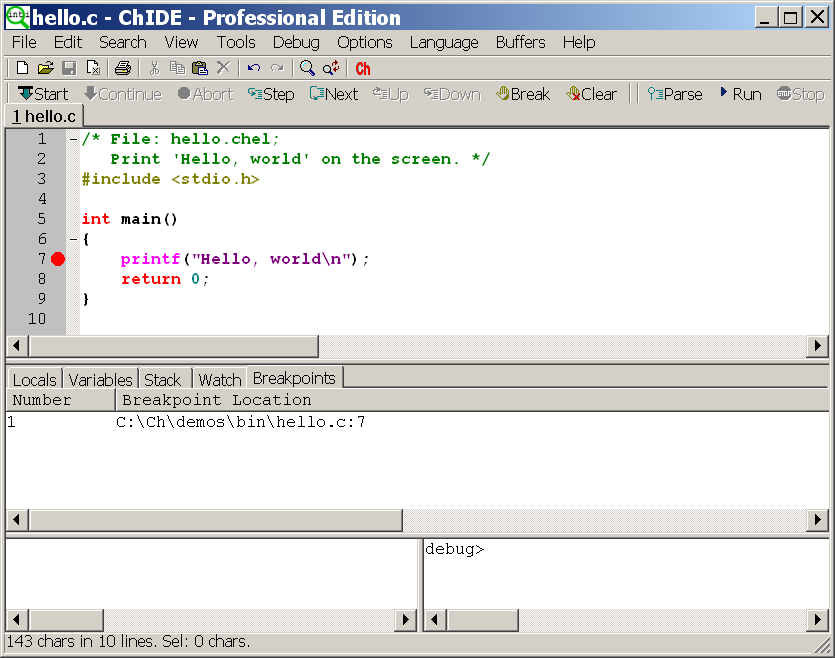
Figure 24: Setting a breakpoint.
The user can execute the program in the editing pane in the debug mode
by Start command or function key F5. The program will stop when a breakpoint is hit.
The user can execute the program line by line either by
command Step or Next.
The command Step
or function key F6
will step into a function whereas or the command Next
or function key F7
will step over the function to the next line.
During the debugging,
the command Continue can be invoked to
continue the execution of the program till it
hits a breakpoint or the program ends.
Before the program execution or during the debugging of an executed program,
new breakpoints can be added to stop the program execution when they are hit.
A breakpoint for a line can be added
by clicking the left margin of the line as shown in
Figure 24.
To clear the breakpoint, clicking the highlighted red mark on
the left margin of the line.
Breakpoints in the debugger can be examined by clicking Breakpoints
on the debug pane selection bar
above the debug pane as shown in
Figure 24.
The debug pane will display the breakpoint number and its location for each breakpoint.
A breakpoint for the current line can also be added by clicking the command Break.
It can also be deleted by clicking the command Clear.
If no breakpoint has been set, the command Clear is non-clickable.
A breakpoint cannot be set in a declaration statement,
However, a breakpoint can be set for
a declaration statement with initialization such as
int i = 10;
The program shall not be edited during when it is being executed and debugged.
Otherwise, a warning message
Warning: Any changes made to the file during debugging will not be reflected
in the current debugging session
will be displayed.
However, when a program is finished its execution,
it can be edited.
When a program is edited by deleting or adding new code,
the breakpoints set for the program will be updated automatically.
The command Step can be used to step into a function.
If the function is not in one of files loaded in the buffer already,
the file containing the function will be loaded.
At the end of the execution of the program, the
file loaded during the debugging will be removed from the buffer.
However, if a breakpoint has been set in the loaded file,
the file will be kept in the buffer when the execution of the program
is finished.
Using debug commands inside the debug command pane,
a breakpoint can also be set for functions and controlling variables,
which will be described later.
When a program is executed in the debug mode, the standard input, output, and error
streams are redirected in a separate Debug Console Window
shown in
Figure 25.
By default, the console window always stays on the top of other windows.
This default behavior can be turned off or on by
the command View | Debug Console Window Always on Top.
The console window can be opened and closed by the command
View | Debug Console Window.
The contents of the console window can be cleared by the command
Debug | Clear Debug Console Window.
The colors for background and
text as well as the window size and
font size of the console window can be changed by right clicking the ChIDE icon
on the upper left corner of the window and selecting
Properties menu to make changes.
Note that for Windows Vista, you need to run ChIDE with the administrative privilege
to make such a change.
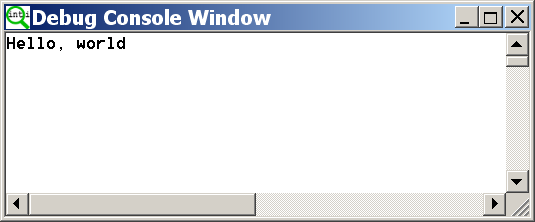
Figure 25: The Debug Console Window for Input/Output in Debugging.
If the program execution has failed and is taking too long to complete,
then the command Abort can be used to stop the program.
When a program is executed line by line by commands Step or Next,
names and their corresponding values of variables
in the current stack can be examined in the debug pane
by clicking menu Locals on the debug pane selection bar.
When the control of the program execution is inside a function,
command Locals displays the values of
local variables and arguments of the function.
When the control of the program execution is not in a function of a script,
command Locals displays the values of global variables of the program.
As shown in
Figure 26,
when program func.c,
available in the directory CHHOME/demos/bin,
is executed at line 9, highlighted by
the green color, local integer variables
i and n are 1 and 10, whereas the array a of double type
contains 1, 2, 3, 4, and 5.
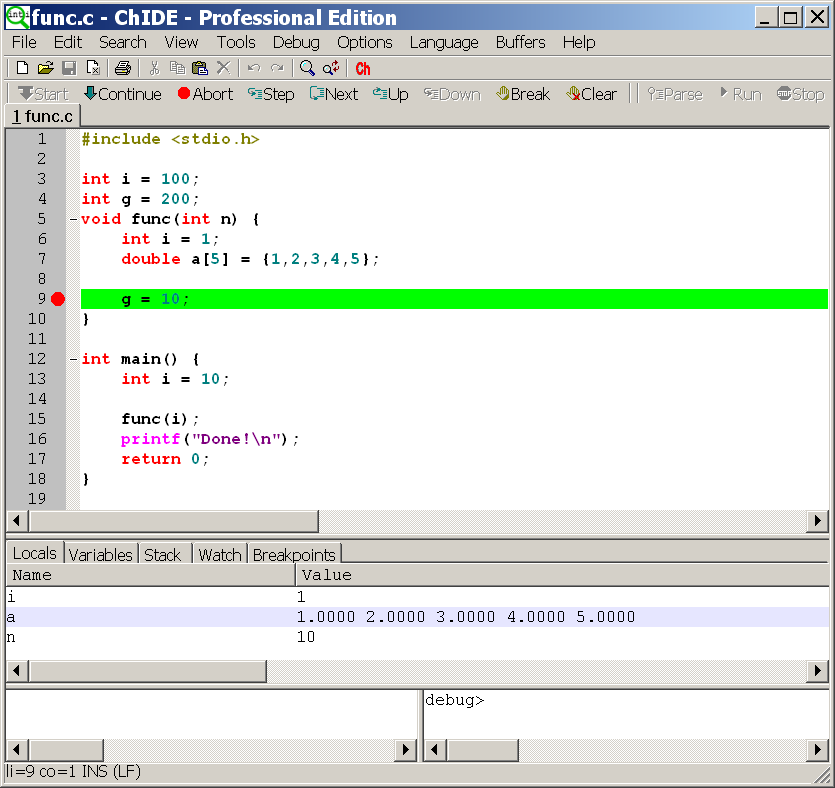
Figure 26: Displaying names and values of local variables in the currently called function.
The user can change the function stack during debugging.
It can go Up to its calling function or move Down to the called function
so that the variables within its scope can be displayed
in the debug pane o accessed in the debug command pane.
Different colors are used to highlight the current line and executing lines in
the calling functions.
For example, when clicking command Up
in Figure 26,
the control flow of the program moves
to its calling function main() at line 15 as highlighted with the blue color also
in Figure 27.
The menu Down as shown
in Figure 26,
is not clickable. But,
the menu Down is clickable
in Figure 27
when the current stack is moved up.
The debug pane at this point displays the
name and value of the variable i, the only regular variable,
in the calling function main().
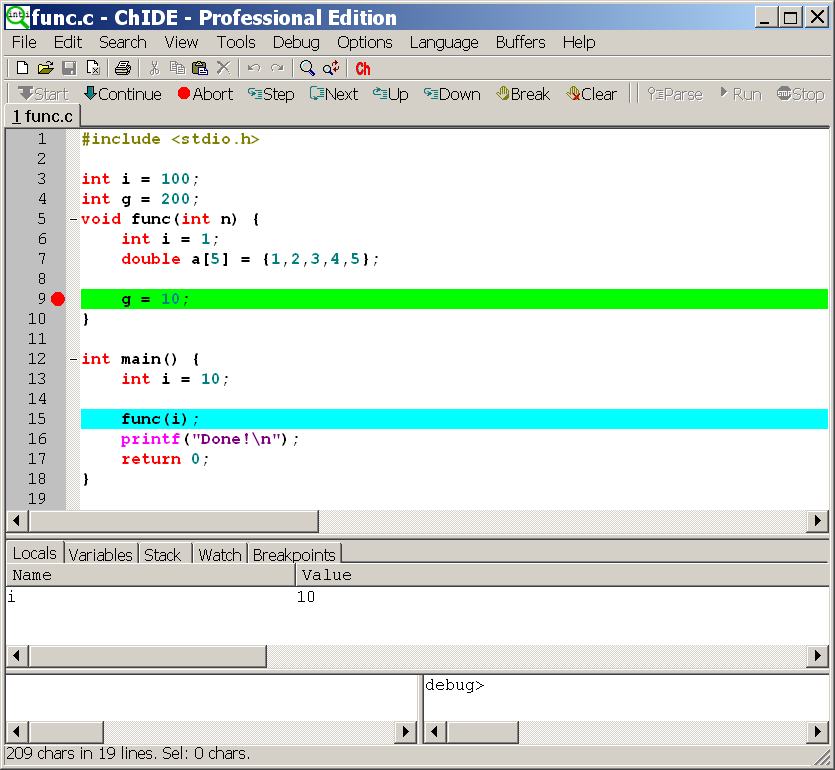
Figure 27: Displaying names and values of local variables in the calling function.
Command Stack
above the debug command
displays function, member function,
or program name and
corresponding stack level in each stack.
For example, as shown in
Figure 28,
function func() is
called by function main(), which in turn is invoked by the program
func.c.
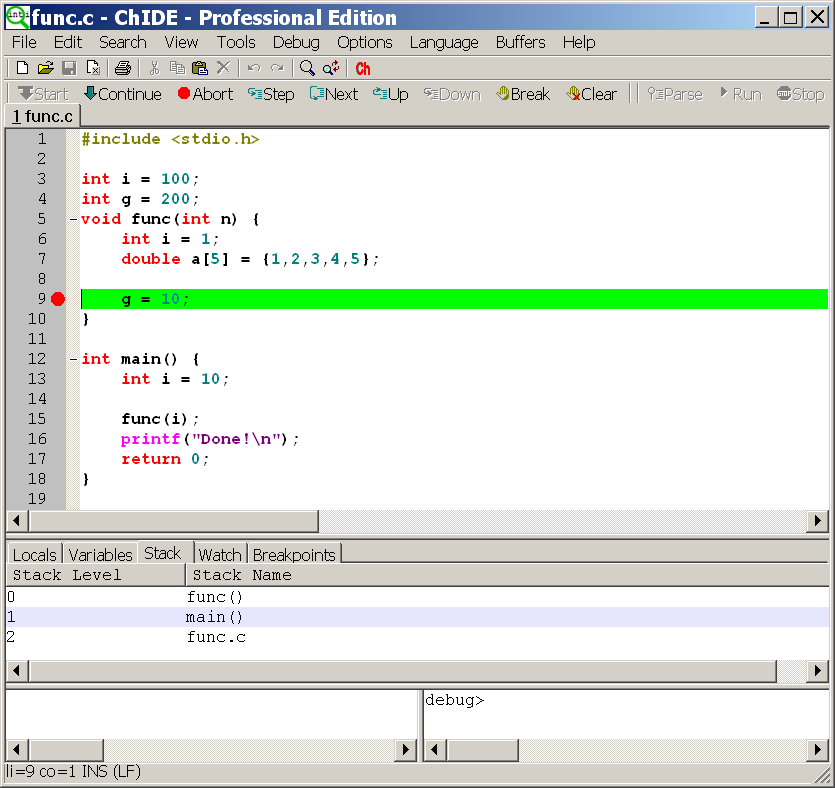
Figure 28: Displaying different stacks for the executing point.
Names and their corresponding values of variables
in all stacks can be displayed by the command Variables
on the debug pane selection bar
as shown in
Figure 29.
Stack levels are highlighted with
the corresponding colors for the current line and executing lines
in the calling functions in the editing pane
as shown in Figure 27.
In Figure 29,
the program is stopped at line 9.
Names and values of local variables inside functions
func() and main() as well as global variables
are displayed in the debug pane. As one can see, before line 9 is executed,
the value of the global variable g is 200.
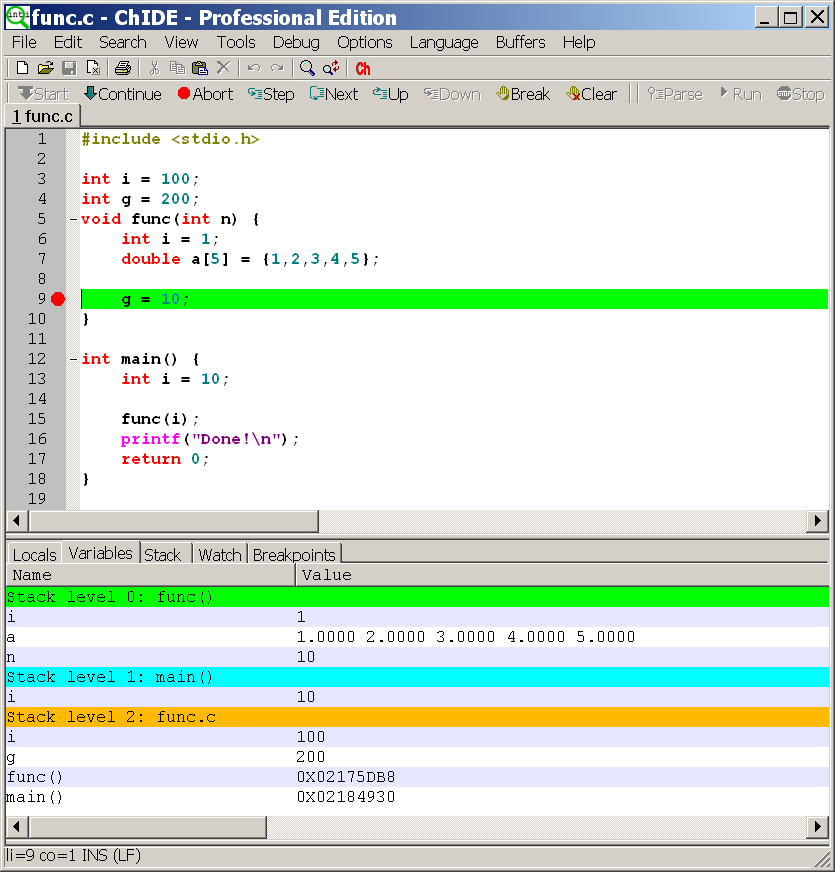
Figure 29: Displaying names and values of all variables in all stacks.
When the command Display special variables in debug pane for
Locals and Variables in the debug menu shown in
Figure 23
is clicked, names and values of
special variables such as __func__ will be displayed in
the debug pane for commands Locals and Variables.
Using Debug Commands Inside the Debug Command Pane
Many debug commands in the debug command pane
are available during the debugging of a program.
A prompt
debug>
inside the debug command pane
indicates that the debugger is ready accept debug commands.
Type command help, it will display all available commands
as shown in
Figure 30.
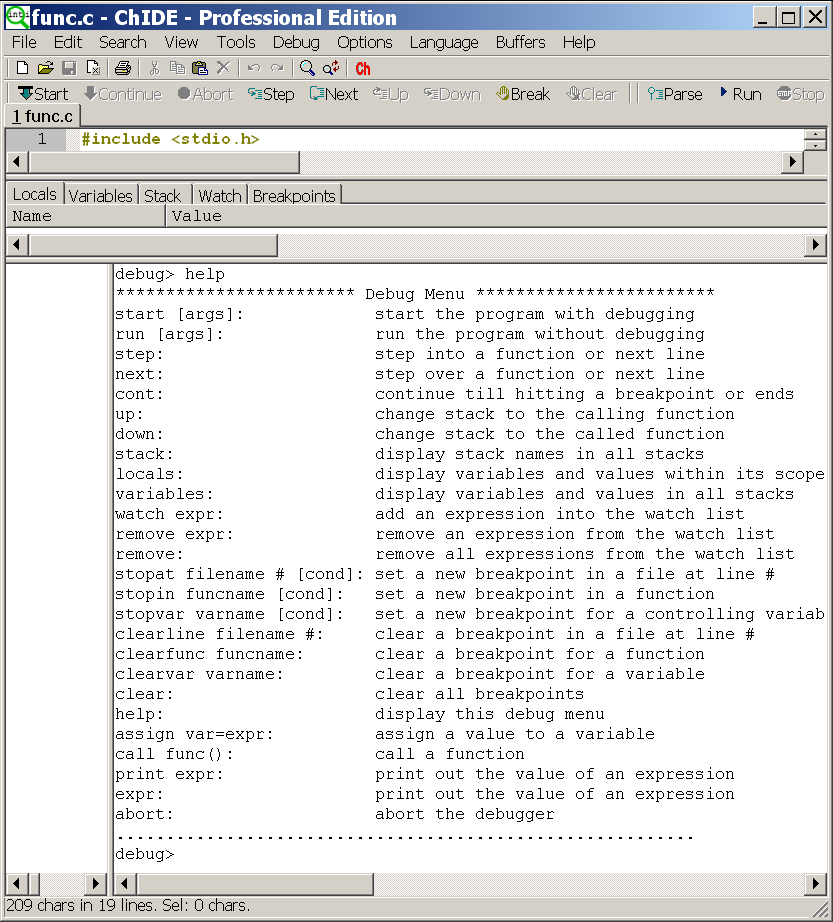
Figure 30: Debug commands in the debug command pane.
The menu on the left before a colon shows a command and the description on the right
explains the action taken for the command.
All commands in the debug bar
are available in this interactive debug command
window. However, some features are available only
through the debug command pane.
The variables, expressions, and functions can be manipulated by
commands assign, call, and print.
The command assign assigns a value to a variable,
call invokes a function, and
print prints out the value of a variable or expression including functions.
It is invalid to print an expression of void type
including a function with return type void.
One can also just type an expression,
the value of the expression will be displayed.
If the expression is a function with the returning type of
void, only the function is called.
For example, commands
    debug> assign i=2*10

    debug> call func()

    debug> print i

    20

    debug> 2*i

    40

    debug>
assign the variable i with the value of 10,
call function func(),
and print out the value of the expression 2*i when the variable
i is valid in its current scope.
As another example, when program func.c is executed and stopped
at line 9 shown in
Figure 31,
the values of variables
a and i as well as expression 2*g can be obtained
by typing corresponding commands in the debug command pane.
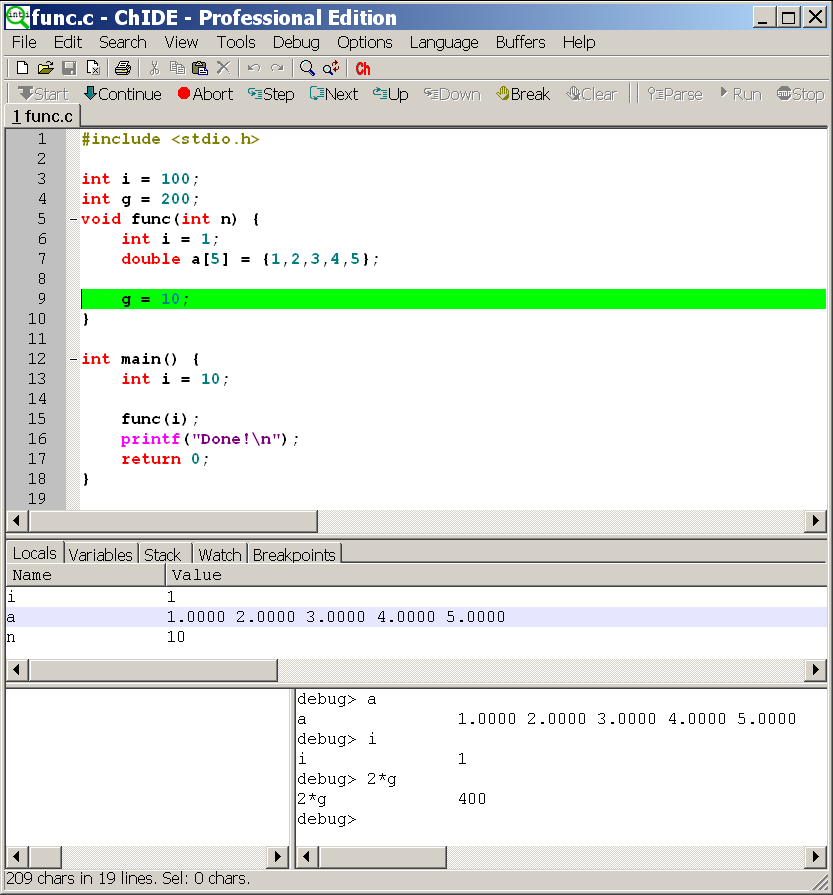
Figure 31: Using debug commands in the debug command pane.
Command 'start' begins debugging a program.
The optional arguments for the command start and run
are processed and passed to the arguments for function main().
For example, to run program C:\Ch\demos\bin\commandarg.c
shown in
Figure 22,
the debug command
debug> start -o option1 -v option2 "option3 with space"
will assign the strings
"C:\Ch\demos\bin\commandarg.c", "-o", "option1", "-v", "option2", and "option3 with space"
to the elements
argv[0], argv[1], argv[2],
argv[3], argv[4], and argv[5]
of argument argv of of the main function
int main(int argc, char *argv[])
of the Ch script commandarg.c, respectively.
The output on the Debug Console Window is similar to that displayed in
the output pane in
Figure 22.
An optional argument with space should be enclosed wit
hin
two double quotation marks as shown
above for the
string "option3 with space".
The program will stop when a breakpoint is hit.
The command run will execute the program
without debugging by ignoring breakpoints.
Similar to commands on the debug bar,
the user can execute the program line by line either by
command step or next.
The command step will step into a function whereas or the command next
will step over the function to the next line.
During the debugging,
the command cont can be invoked to continue the execution of the program till it
hits a breakpoint or the program ends.
The user can change the function stack during debugging.
It can go up to its calling function or move down to the called function by
commands up and down, respectively,
so that the variables within its scope can be accessed in the debug command pane.
The function or program names in all stacks are displayed by the command stack.
Names and their corresponding values of variables
in the current stack are displayed by the command locals.
Command variables
displays names and values for all variables within its scope in each stack.
The command watch adds an expression, including a single variable,
into a list of watched expressions.
Watched expressions can be added before or during execution of a program.
An expression can be removed from the list of the watched expressions by
the command. remove expr
The command remove removes all expressions in the watched list.
For example, commands in the debug command pane
    debug> watch 2*g

    debug> i
add expression 2*g and variable i to a list of watched expressions
as shown in
Figure 32.
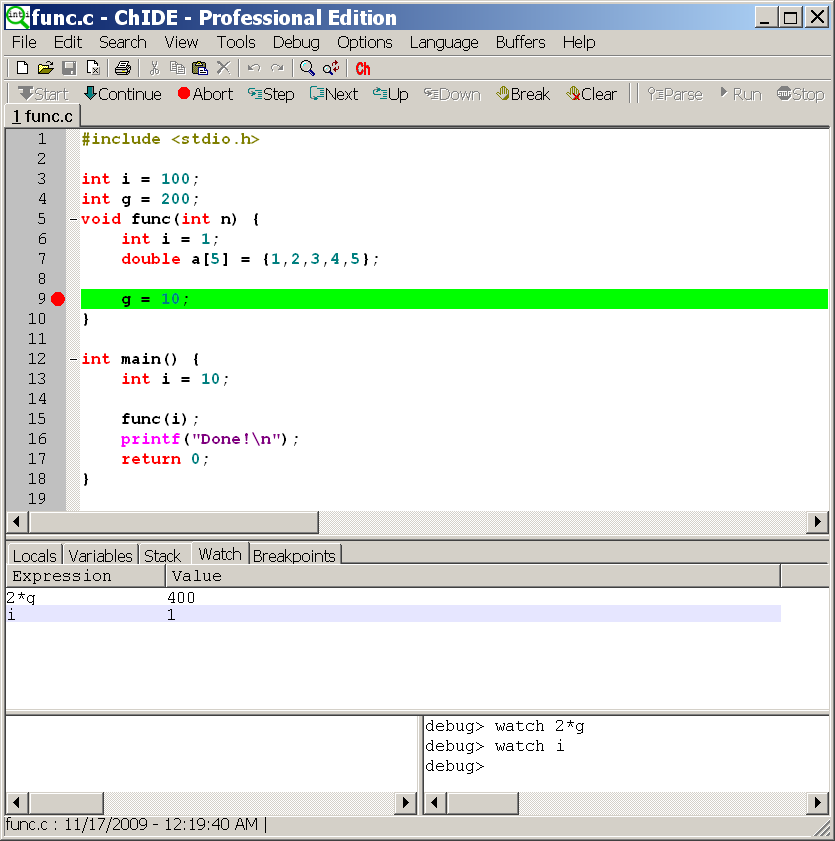
Figure 32: Setting watch expressions and variables in the debug command pane
to display their values in the debug pane.
When a program is stopped at a breakpoint or stepped into next statement,
the values of these watched expressions can be viewed in the debug pane
by clicking the command Watch
on the debug pane selection bar
as shown in
Figure 32.
Before the program execution or during the debugging of an executed program,
new breakpoints can be added to stop the program execution.
A breakpoint can be setup based on three specifications:
file name and line number, function, and controlling variable.
When a breakpoint is setup in a function, the program will stop
at its first executable line of the function.
When a breakpoint is setup for a variable, the program will stop when the value of the
variable changes. Each breakpoint can have an optional conditional expression.
When a breakpoint location is reached, the conditional expression is evaluated
if it exists. The breakpoint is hit only if the expression
is either true or has changed
which needs to be specified when the breakpoint was added.
By default, the breakpoint is hit only if the expression is true.
Command stopat
sets a new breakpoint
specified by a file name and line number in the subsequent arguments.
The program breaks execution when it reaches this location.
Command stopin
sets a new breakpoint for a function.
The program breaks execution when it reaches the
first executable line of the function.
Command stopvar
sets a new breakpoint for a controlling variable.
The variable is evaluated while the program is running.
The program breaks execution when the value of the variable changes.
When each of these command is invoked, a breakpoint is appended to the
list of breakpoints. The optional conditional expression and triggering method
for each breakpoint are passed as the last two arguments of these commands.
For example, the syntaxes for setting a breakpoint in a file
with a complete path and line number are as follows.
    debug> stopat filename #

    debug> stopat filename # condexpr

    debug> stopat filename # condexpr condtrue
When a breakpoint location
is reached, the optional expression condexpr
is evaluated.
If the argument condtrue is true or missing,
the breakpoint will be hit if the value for the expression is true;
otherwise,
the breakpoint will be hit if the value for the expression has changed.
For example, the command
debug> stopat C:/Ch/demos/bin/func.c 6
sets a breakpoint in file func.c located at
the directory C:/Ch/demos/bin at line 6.
The command
debug> stopat C:/Ch/demos/bin/func.c 6 i+j 1
sets a breakpoint in file func.c at line 6.
When the breakpoint location in file func.c at line 6
is reached, the expression
i+j is evaluated and
the breakpoint will be hit if the value for the expression i+j is true.
The above command is the same as
debug> stopat C:/Ch/demos/bin/func.c 6 i+j
The command
debug> stopat C:/Ch/demos/bin/func.c 6 i+j 0
sets a breakpoint in file func.c at line 6.
When the breakpoint location in file func.ch at line 6
is reached, the expression
i+j is evaluated and
the breakpoint will be hit if the value for the expression i+j has changed.
On the other hand,
commands
clearline,
clearfunc, and
clearvar with proper arguments remove a breakpoint of line, function, and variable type
in the list, respectively.
Command
clear removes all breakpoints in the debugger.
If the program execution has failed and is taking too long to complete,
then the abort command can be used to stop the program.
The contents in the debug command pane can be cleared by clicking the
command View | Clear Debug Command Pane.
Interactive Execution of Commands in the Output Pane
Binary commands and C/C++ programs can also be executed interactively inside the output pane as shown
in Figure 33.
In Figure 33,
the program hello.c is executed first in the output pane.
Then, the command pwd
pane prints the current working directory.
The command ls lists files and directories in the current working directory.
Options of a command can also be provided. For example, the command
ls can invoked in the form of
ls -F
to list directories with a forward slash at the end.
To use a command with a complete path which containing
a white space,
the path needs to be placed
inside a pair of double quotation marks, as shown below.
"C:/Documents and Settings/Administrator/c99/hello.c"
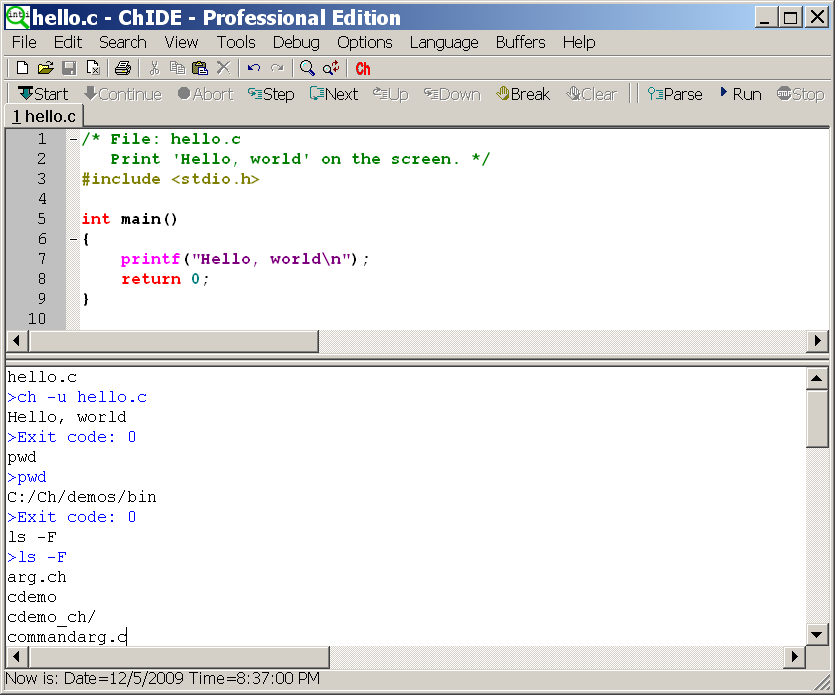
Figure 33: Executing commands inside the output pane.
Compiling and Linking C/C++ Programs
ChIDE can also compile and link an edited C/C++ program in the editing pane
using C and C++ compilers. By default, the ChIDE is configured to
use the latest Microsoft Visual Studio .NET installed in your Windows
to compile C and C++ programs.
The environment variables and commands for the Visual Studio compiler
can be modified in the individual startup configuration file _chrc
in the user's home directory, which can be opened for editing as shown in
Figure 12.
In Linux, ChIDE uses compilers gcc and g++ to compile C and C++ programs, respectively.
The default compiler can be changed by modifying the C/Ch/C++ property file
cpp.properties which can be opened under the command Options.
The command Tools | Compile as shown in
Figure 34
can be used to compile a program.
The output and error messages
for compiling a C or C++ program are displayed in the output pane of the ChIDE.
In Windows, compiling a program will create an object file with file extension .obj.
The object file can be linked using
the command Tools | Link to create an executable
program. The executable in Windows has file extension .exe.
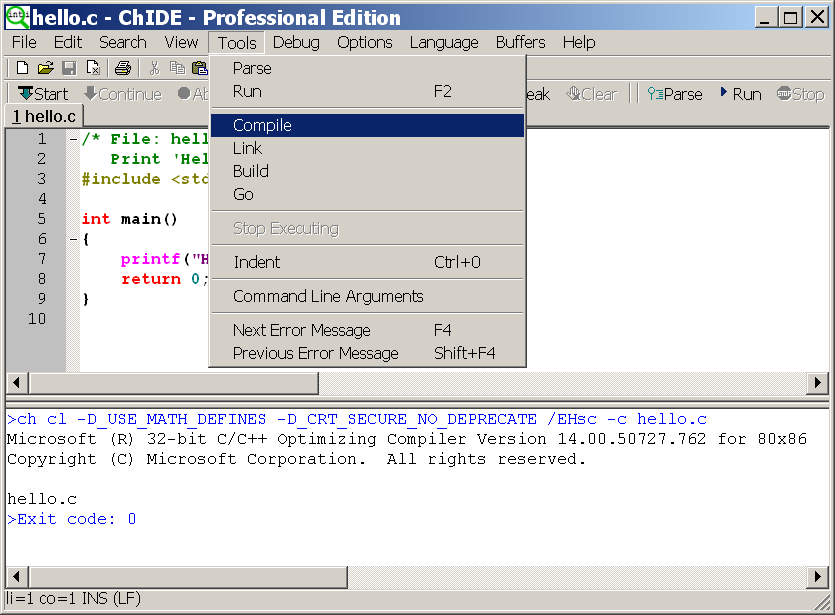
Figure 34: Compiling a C/C++ program.
If a make file makefile or Makefile is available in the current directory,
the command Tools | Build will invoke
the Makefile to build an application.
A make file can also be invoked by right clicking the file name
on the file tab, then clicking the command make in Linux or Mac and the command make or
nmake in Windows
as shown in Figure 34.

Figure 35: Using a make file to compile a C/C++ program.
When ChIDE is used to edit a make file, the syntax will be highlighted.
Because the tab character is reserved as a special character to begin
a command for some make command, it be preserved and not replaced with white spaces.
A file with the file extension .mak or with the following file name
is recognized as a make file in ChIDE:
      makefile


      makefile.win


      makefile_win


      makefile.Win


      makefile_Win


      Makefile


      Makefile.win


      Makefile_win


      Makefile.Win


      Makefile_Win
The command Tools | Go will execute the developed
executable program.
Buffers in ChIDE
ChIDE has 20 buffers by default, each containing a
file. The number of the default buffers can be changed in the user option file.
The Buffers menu can be used to switch between buffers, either by selecting the
file name or using the Buffer | Previous File and Buffer | Next File commands.
When all the buffers contain files, then opening a new file causes a buffer to be reused
which may require a file to be saved. In this case an alert is displayed to ensure the user
wants the file saved.
Sessions in ChIDE
A session is a list of file names and some options for ChIDE.
You can save a complete set of your
currently opened buffers as a session for fast batch-loading in the
future.
Sessions are stored as plain text files with the extension ".session".
Use File | Load Session and File | Save Session to load/save sessions.
You can turn on/off "last session autoloading" using ChIDE properties
variable "save.session".
By default, session management is turned on.
Loading previously saved session will close your currently opened
buffers. However you will not loose your edits, because you will be
asked to save unsaved buffers first.
Opening a specific file from command line overrides "save.session"
variable state. When you start ChIDE loading a specific file from
command line last session will not restore even if "save.session"
variable is set to "1". This makes "save.session" safe to use - you
will never open a couple of files when you are trying to open just
one, specific file.
Languages Understood by ChIDE
ChIDE currently is able to syntax style these languages (* denotes
support for folding):
- C/Ch/C++*
- CSS*
- HTML*
- Make
- SQL and PLSQL
- TeX and LaTeX
- XML*
Language settings are determined from the file extension but this can be changed
by selecting another language from the Language menu. The language menu can be
changed with the menu.language property.
Edit in ChIDE
Most text editing features in a work processor such as Microsoft Word are available in
ChIDE. Menus on the toolbar and menus under the command Edit can be used to edit programs
in the editing pane.
Right clicking on the editing pane will also bring up
the commonly used editing commands
as shown in Figure 36.
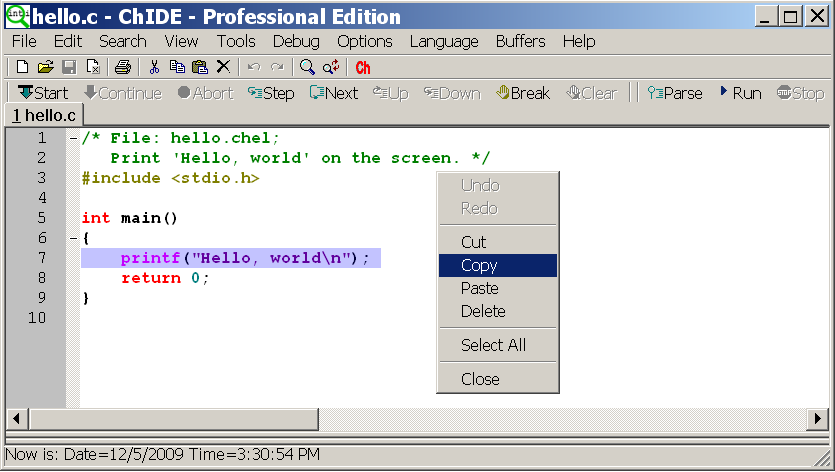
Figure 36: Using editing commands by right clicking on the editing pane.
As the user inputs the text into the editing pane,
if the input string matches a word in the edited file,
the matched word will be displayed.
The user can hit the Enter key to automatically complete the input for the matched word.
However, the user can type Ctrl+Enter to list all matched words,
use the arrow key to select a word, then type Enter key to complete the word.
Find and Replace in ChIDE
ChIDE has options to allow searching for words, regular expressions,
matching case, in the reverse direction, wrapping around the end of the
document.
C style backslash escapes which are listed in the command line
arguments section, may be used to search and replace control
characters.
Replacements can be made individually, over the current selection or
over the whole file. When regular expressions are used tagged
subexpressions can be used in the replacement text.
Regular expressions will not match across a line end.
ChIDE supports
basic regular expressions
with tagging.
Keyboard Commands in ChIDE
ChIDE uses the default key bindings defined in Scintilla, so
keyboard commands in ChIDE mostly follow common Windows and GTK+ conventions.
All move keys (arrows, page up/down, home and end)
allows to extend or reduce the stream selection when holding the Shift key,
and the rectangular selection when holding the Shift and Alt keys.
Some keys may not be available with some national keyboards or because
they are taken by the system such as by a window manager on GTK+.
The user.shortcuts setting may be used to assign a key to a function.
Note that Home key behaviour is changed by the vc.home.key option.
Keyboard equivalents of menu commands are listed in the menus.
Below are the commonly used commands and their corresponding keyboard commands.
| Help. | F1 |
| Run C/Ch/C++ program in Ch. | F2 |
| Find Next. | F3 |
| Find Previous. | Shift+F3 |
| Next Error Message. | F4 |
| Previous Error Message. | Shift+F4 |
| Start (Debug the program). | F5 |
| Step (Single step). | F6 |
| Next (Step over the next statement). | F7 |
| Close/Open Output Pane. | F8 |
| Clear Output Pane. | F9 |
| Clear Debug Command Pane. | F10 |
| Close/Open Debug Console Window. | F11 |
| Full screen. | F12 |
Some less common commands with no menu equivalent are:
| Magnify text size. | Ctrl+Keypad+ |
| Reduce text size. | Ctrl+Keypad- |
| Restore text size to normal. | Ctrl+Keypad/ |
| Cycle through recent files. | Ctrl+Tab |
| Indent block. | Tab |
| Dedent block. | Shift+Tab |
| Delete to start of word. | Ctrl+BackSpace |
| Delete to end of word. | Ctrl+Delete |
| Delete to start of line. | Ctrl+Shift+BackSpace |
| Delete to end of line. | Ctrl+Shift+Delete |
| Go to start of document. | Ctrl+Home |
| Extend selection to start of document. | Ctrl+Shift+Home |
| Go to start of display line. | Alt+Home |
| Extend selection to start of display line. | Alt+Shift+Home |
| Go to end of document. | Ctrl+End |
| Extend selection to end of document. | Ctrl+Shift+End |
| Go to end of display line. | Alt+End |
| Extend selection to end of display line. | Alt+Shift+End |
| Expand or contract a fold point. | Ctrl+Keypad* |
| Create or delete a bookmark. | Ctrl+F2 |
| Select to next bookmark. | Alt+F2 |
| Find selection. | Ctrl+F3 |
| Find selection backwards. | Ctrl+Shift+F3 |
| Scroll up. | Ctrl+Up |
| Scroll down. | Ctrl+Down |
| Line cut. | Ctrl+L |
| Line copy. | Ctrl+Shift+T |
| Line delete. | Ctrl+Shift+L |
| Line transpose with previous. | Ctrl+T |
| Line duplicate. | Ctrl+D |
| Find matching preprocessor conditional, skipping nested ones. | Ctrl+K |
| Select to matching preprocessor conditional. | Ctrl+Shift+K |
| Find matching preprocessor conditional backwards, skipping nested ones. | Ctrl+J |
| Select to matching preprocessor conditional backwards. | Ctrl+Shift+J |
| Previous paragraph. Shift extends selection. | Ctrl+[ |
| Next paragraph. Shift extends selection. | Ctrl+] |
| Previous word. Shift extends selection. | Ctrl+Left |
| Next word. Shift extends selection. | Ctrl+Right |
| Previous word part. Shift extends selection | Ctrl+/ |
| Next word part. Shift extends selection. | Ctrl+\ |
Abbreviations in ChIDE
To use an abbreviation, type it and use the Edit | Expand Abbreviation
command or the Ctrl+B key. The abbreviation is replaced by an
expansion defined in the Abbreviations file. You can open the
Abbreviations file with a command in the Options menu and
add abbreviations.
Each line in the files looks like "abbreviation=expansion".
The abbreviations names can have any character (except perhaps control chars,
surely for CR and LF), including high ASCII chars (accented chars).
Names have properties files limits: they cannot start with sharp (#) or space or tab
(but can have spaces inside); and they cannot have '=' character inside.
Abbreviations names are limited to 32 characters. It is probably enough for
abbreviations...
An expansion may contain new line characters indicated by '\n' and
a caret position indicated by the '|' character. To include a literal '|'
character, use '||'.
When expanding, the names don't need to be separated from the previous text.
i.e. if you define 'ë' as 'é', you can expand it inside a word.
If a name is the ending of another one, only the shorter will ever be expanded.
Ie. if you define 'ring' and 'gathering', the later will see only the 'ring' part expanded.
The global abbreviations for writing C/C++ can be opened by the command
Options | Open ChIDE Global Abbreviation File. The global abbreviations can be overwritten
by the user abbreviation. The user abbreviation file can be opened by the command
Options | Open ChIDE User Abbreviation File.
The global programming abbreviations can be used to speed up the
typing and indenting programs.
The following global abbreviations have been predefined for writing C/C++ programs.
| Abbreviation | Description |
| com | /* | */ |
| inc | #include <|> |
| myinc | #include "|" |
| def | #define | |
| | |
| main | function main() |
| mainarg | function main() with arguments |
| | |
| if | if statement |
| elseif | else if statement |
| else | else statement |
| for | for loop |
| while | while loop |
| do | do-while loop |
| switch | switch statement |
| foreach | foreach loop |
| | |
| a | [|] for an array index |
| c | '|' for a character |
| s | "|" for a string |
| p | (|) for parentheses |
| | |
| pi | M_PI| |
| epsilon | FLT_EPSILON| |
| cond | | ? : for conditional operator |
| sizeof | sizeof(|) |
| | |
| struct | struct |
| union | union |
| enum | enum |
| class | class |
| | |
| stdlib.h | include stdlib.h |
| time.h | include time.h |
| assert.h | include assert.h |
| complex.h | include complex.h |
| ctype.h | include ctype.h |
| errno.h | include errno.h |
| fenv.h | include fenv.h |
| float.h | include float.h |
| inttypes.h | include inttypes.h |
| iso646.h | include iso646.h |
| limits.h | include limits.h |
| locale.h | include locale.h |
| math.h | include math.h |
| setjmp.h | include setjmp.h |
| signal.h | include stdarg.h |
| stdarg.h | include stdarg.h |
| stdbool.h | include stdbool.h |
| stddef.h | include stddef.h |
| stdint.h | include stdint.h |
| stdio.h | include stdio.h |
| stdlib.h | include stdlib.h |
| string.h | include string.h |
| tgmath.h | include tgmath.h |
| time.h | include time.h |
| wchar.h | include wchar.h |
| wctype.h | include wctype.h |
| chdl.h | include chdl.h |
| chplot.h | include chplot.h |
| chshell.h | include chshell.h |
| numeric.h | include numeric.h |
| | |
| func | a function definition |
| prot | |(); for a function prototype |
| call | |(); for calling a function |
| | |
| printf | printf("|\n"); |
| scanf | scanf("|", &); |
| sin | sin(|) |
| a standard function name | call the standard function |
A sample abbreviation hw is included in the distributed default user abbreviations file.
If you type the abbreviation hw followed by the Ctrl+B key, the contents for
the header for a homework assigment
as shown in Figure 37
will be added in the editing pane conveniently.
You may edit the user abbreviation file by the command
Options | Open ChIDE User Abbreviation File to configure the abbreviation
hw with your name and relevant information for a class or project.
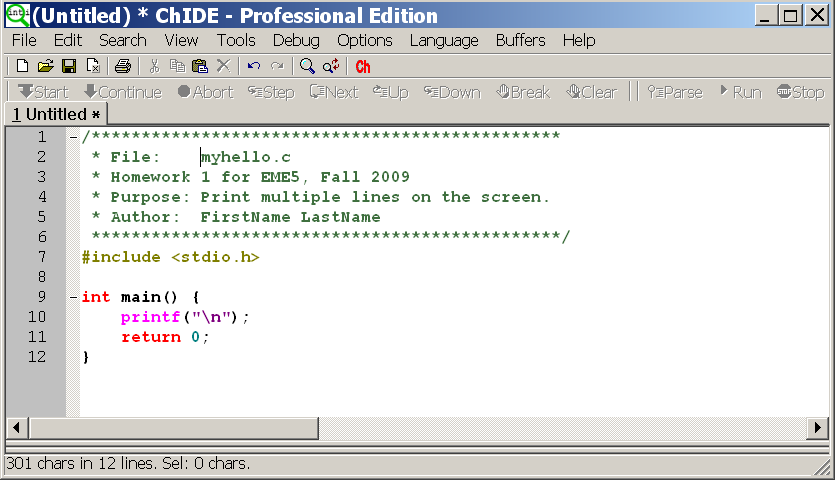
Figure 37: Using the abbreviation hw to create the header for a homework assignment.
Folding in ChIDE
ChIDE supports folding for many languages (see the list of languages
understood by ChIDE for more information.)
Fold points are based upon indentation for C and on counting braces
for the other languages. The fold point markers can be clicked to
expand and contract folds. Ctrl+Shift+Click in the fold margin
will expand or contract all the top level folds. Ctrl+Click on a fold
point to toggle it and perform the same operation on all children.
Shift+Click on a fold point to show all children.
Encodings in ChIDE
ChIDE will automatically detect the encoding scheme used for Unicode files that
start with a Byte Order Mark (BOM).
The UTF-8 and UCS-2 encodings are recognized including both Little Endian and
Big Endian variants of UCS-2.
UTF-8 files will also be recognized when they contain a coding cookie on one of the
first two lines. A coding cookie looks similar to "coding: utf-8" ("coding" followed by ':'
or '=', optional whitespace, optional quote, "utf-8") and is normally contained in
a comment:
# -*- coding: utf-8 -*-
For XML there is a declaration:
<?xml version='1.0' encoding='utf-8'?>
For other encodings set the code.page and character.set properties.
Note:
ChIDE is developed using Embedded Ch and Scintilla/SciTE.
Scintilla/SciTE is Copyright 1998-2003 by Neil Hodgson.
The complete Scintilla/SciTE license is included in license_Scintilla in the Ch installation directory.
|